


Full AEC feature @
https://www.aecmag.com/component/content/article/59-features/1568-laser-scanning-for-verification
3D Laser Scanning for Verification.
Accuracy in Construction
Within construction and architectural manufacturing processes, some degree of dimensional variability is inevitable. It will occur even when operatives are fully trained, experienced and make a genuine attempt to achieve the specified sizes and dimensions stipulated by drawings, specifications and BIM models.
Research undertaken by the British Research Establishment [BRE] into the variability in building processes concluded this variability arises because of the physical limitations of the operatives, tools or materials utilised. Subsequently, this led to the formulation of BS 5606:1978 - The Code of Practice for Accuracy in Building now BS 5606:1990 - Guide to Accuracy in Building. It aims to provide advice on how to avoid problems of inaccuracy and dimensional variability inherent within the construction industry.
Historically, buildings were relatively simple, constructed by craftsmen using traditional methods of construction and with a limited material palette. They understood their craft and could adjust their work as required to overcome any irregularities onsite.
Today, construction is complex. A network of relationships, procurement methods, critical paths, trades and specialist subcontractors, utilising a myriad of construction techniques and manufacturing processes varying from prefabricated precision engineering to more traditional forms of onsite construction. Thus, active review of the as-built progress onsite to identify misaligned or out-of-tolerance elements is an extremely valuable exercise which seems to be growing in popularity with contractors looking to de-risk their projects by identifying mistakes and dimensional variabilities before they become costly errors.
This has been driven by developments in software and a growing accessibility to the precession world of 3D laser scanning through lower cost scanners like the Leica 360 BLK.
However, the actual verification process between the as-built pointcloud produced from the laser scan, with the geometry of the BIM / fabrication model, has been a somewhat manual exercise. It is usually undertaken as a ‘sense check’ in only a few critical locations and visualised in plan or section resulting in limited verification in only one or two planes.
Vertiy - Automated Verification
‘Verity’ is a fully integrated software plugin which utilises advanced algorithms to automate the verification process within the Autodesk Navisworks. Developed by ClearEdge3D, it compares the 3D laser scanned pointcloud of the as-built work onsite with the as-designed BIM / fabrication model, producing clear visual outputs that illustrate deviations of elements as well as detailed reports for circulation with the design team. This is an automated process, pulling the selected pointcloud and as-designed elements from Navisworks into Verity to analyse the data, producing a concise table of results based on a predetermined tolerance range. Information displayed for each analysed element includes amongst others; Item Description, Surface Geometry Area, Installation Status, Item Tolerance, detailed Transition and Rotation data, but most notably the Conformance to Tolerance stating whether or not the respective element falls within the stipulated tolerance range.
Following the analysis, Verity offers a number of tools to review and interrogate the data, and even amend the geometry to reflect the as-built pointcloud by moving the as-designed elements to the as-built positions at the click of a button.
Case Study - REEF Project
In order to fully understand Verity’s processes, workflows and potential, we put the software through its paces on a live project onsite at the University of Exeter’s Penryn Campus in Cornwall, England.
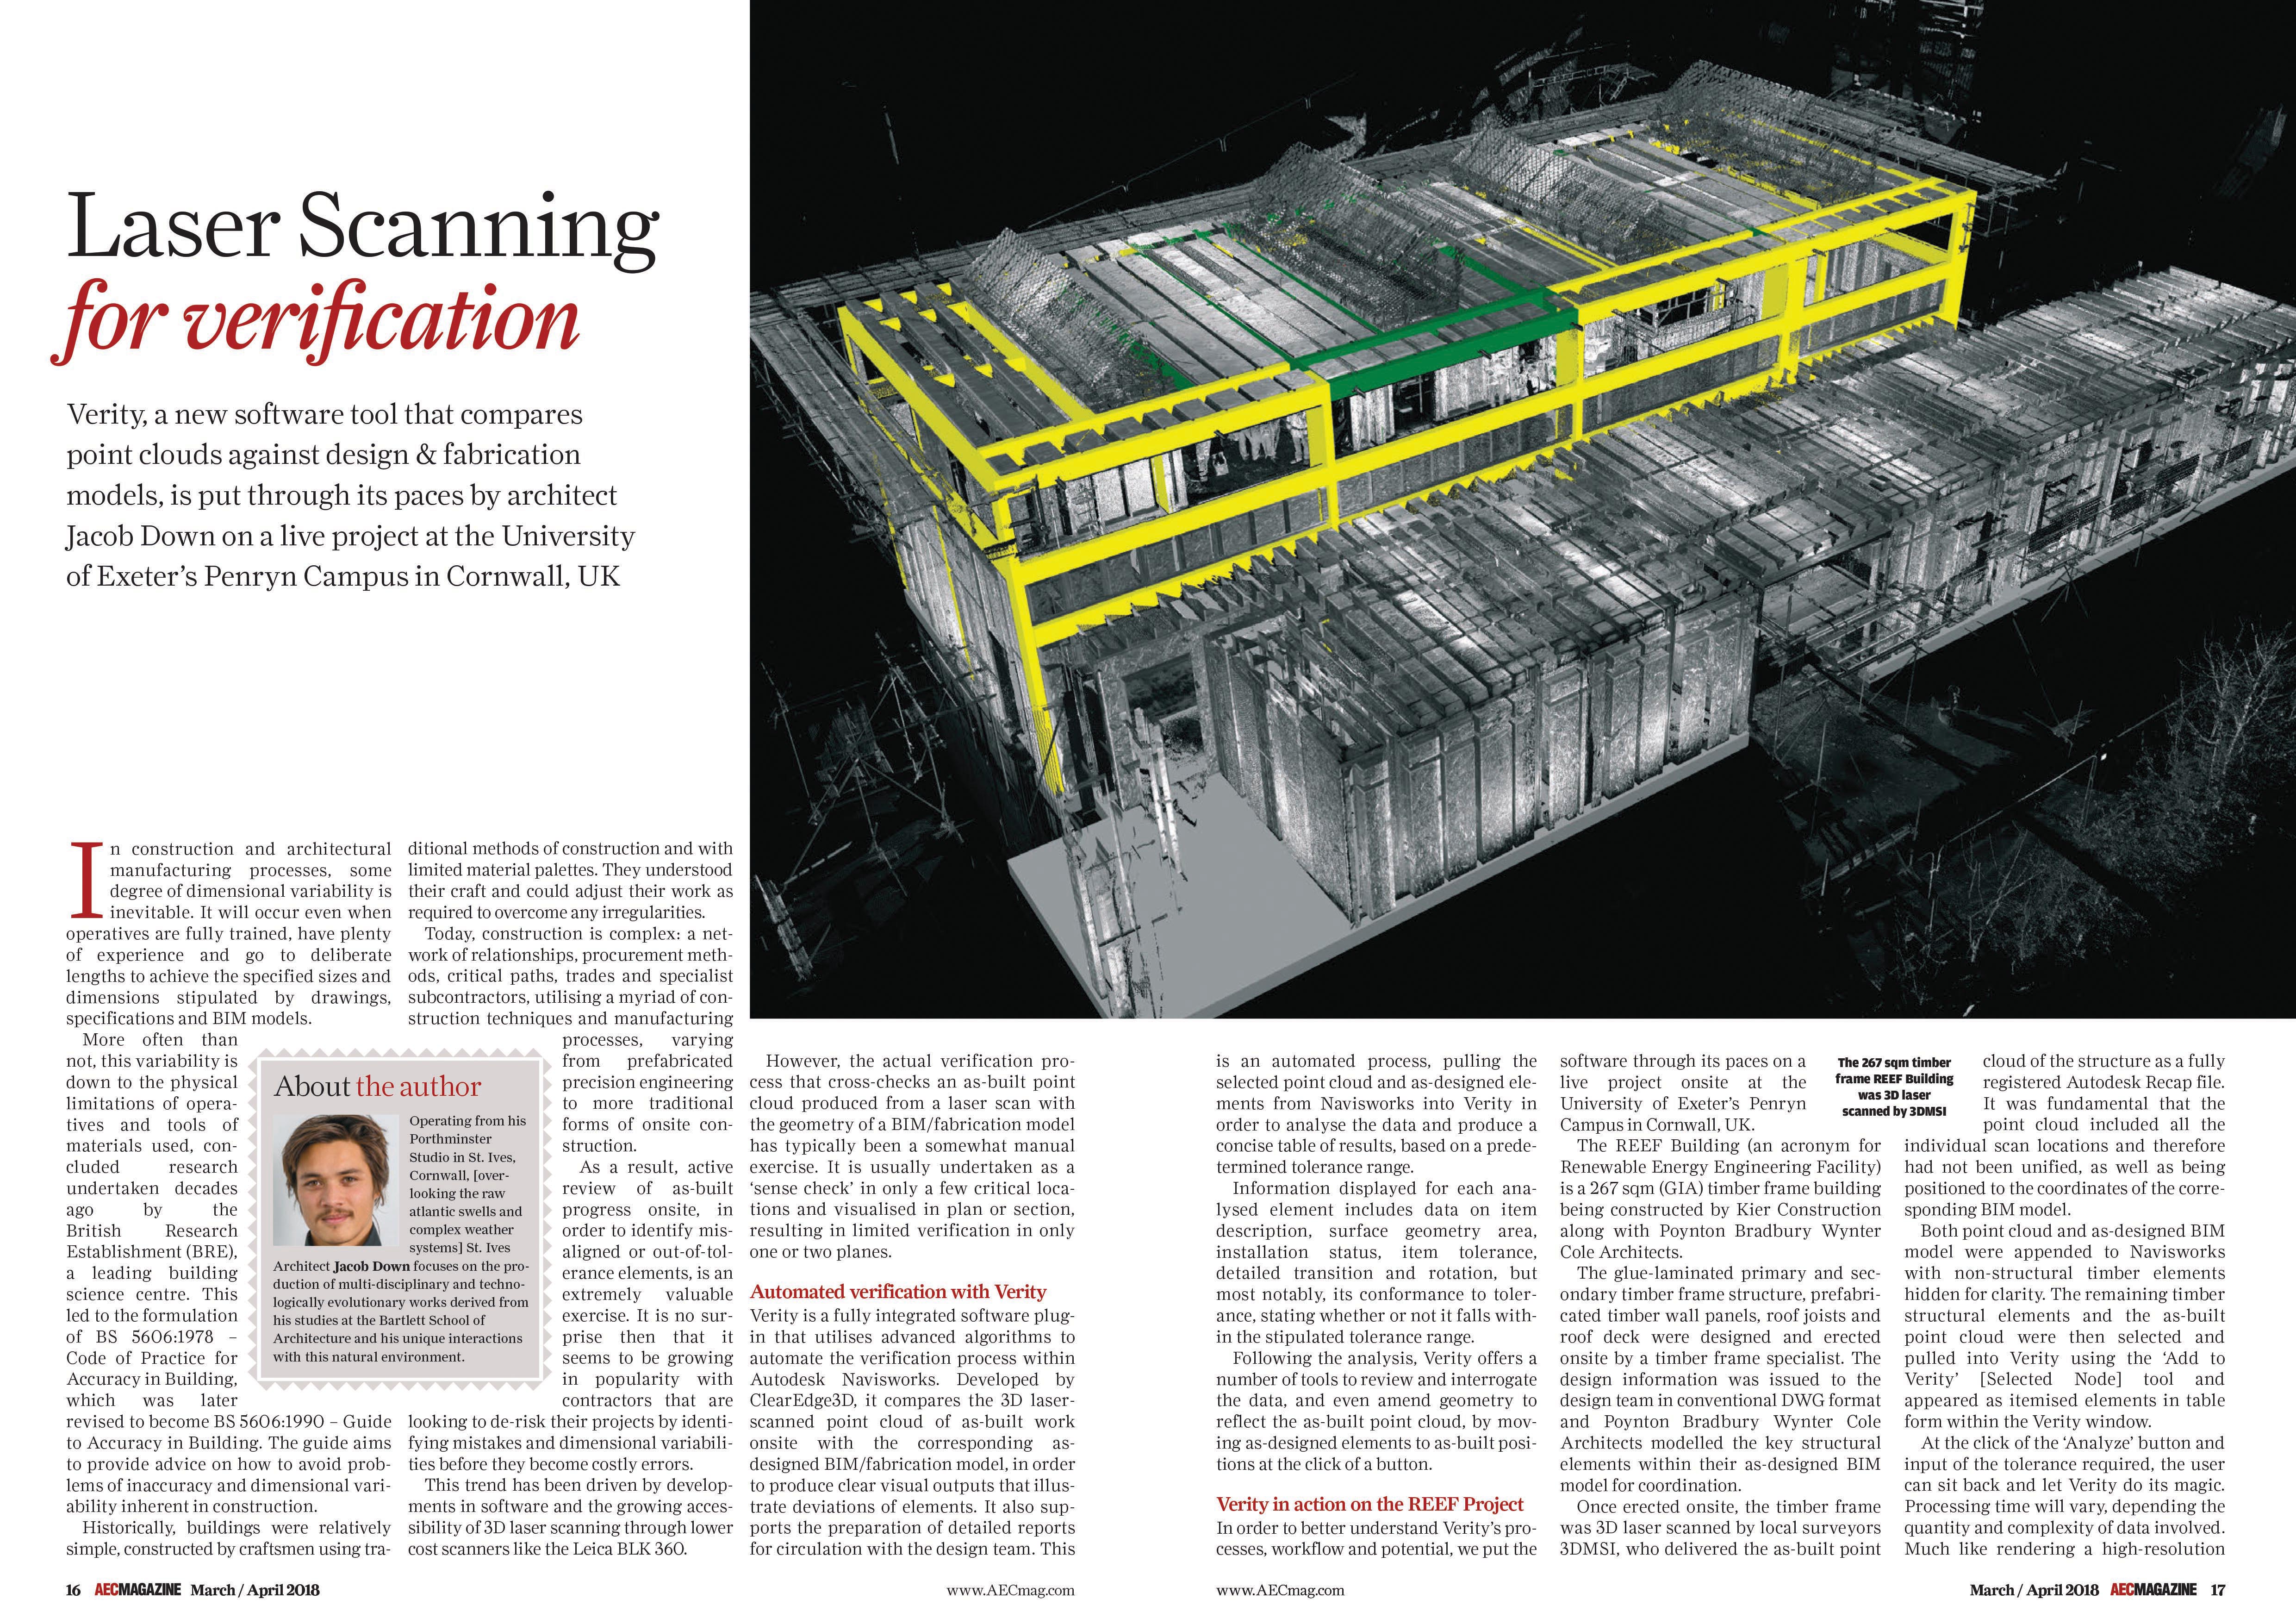
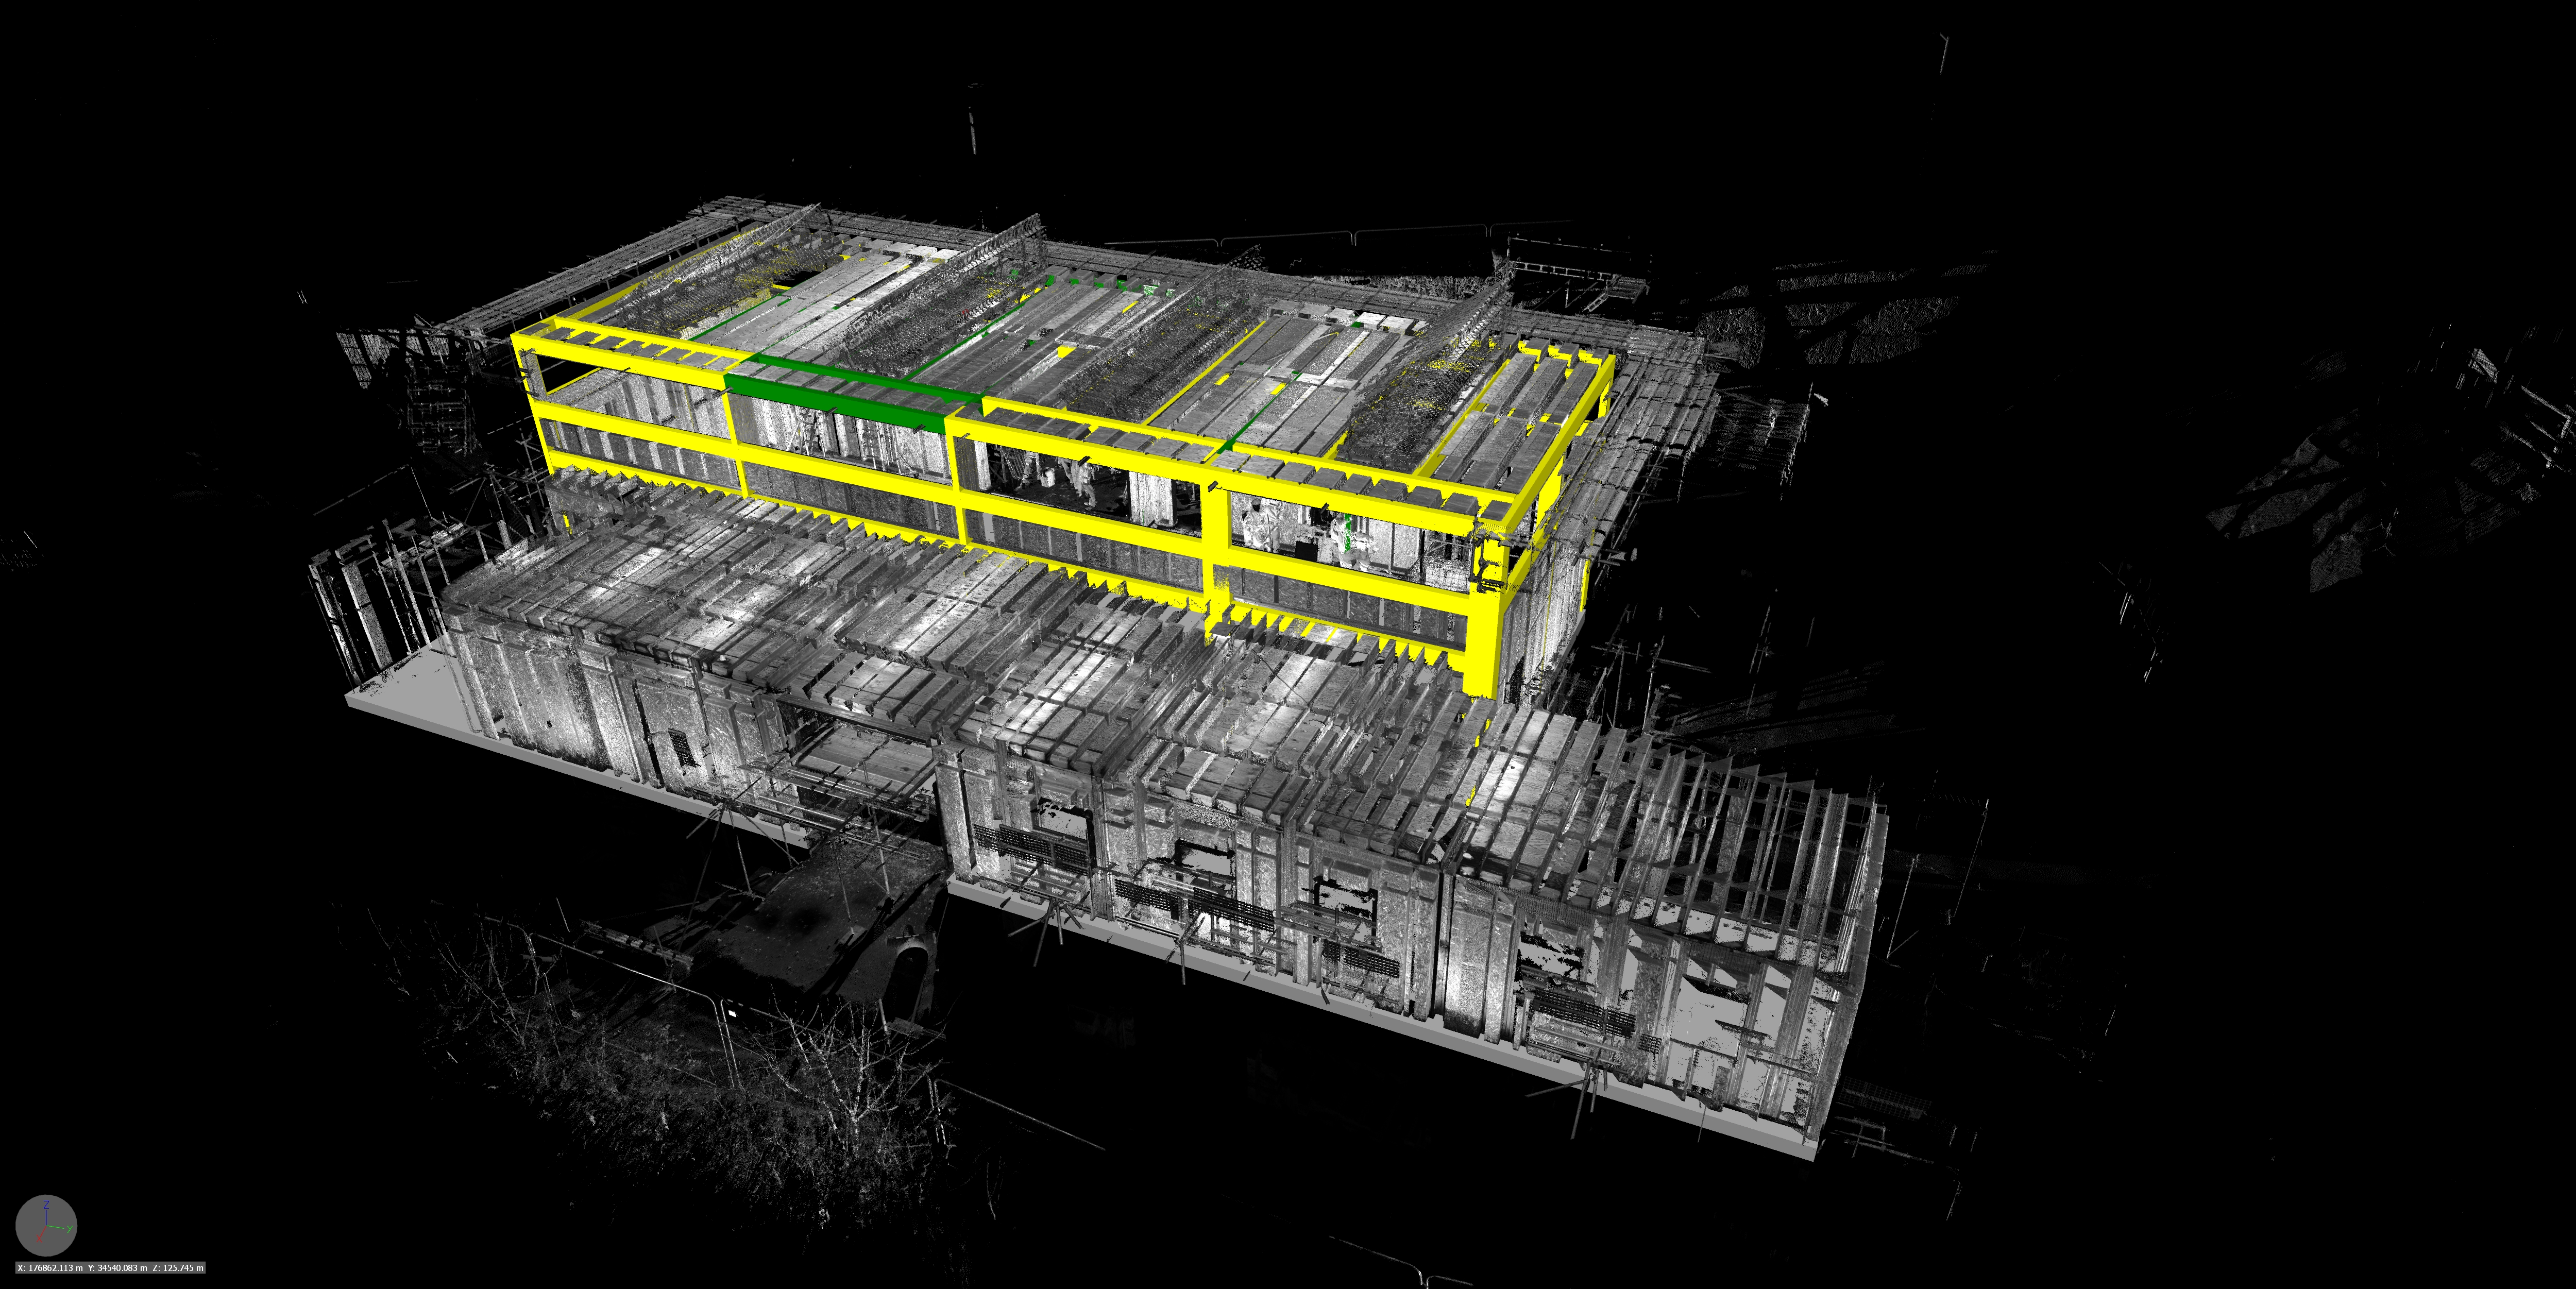
The REEF Building [an acronym for Renewable Energy Engineering Facility] is a 267 sqm [GIA] timber frame building being constructed by Kier Construction along with Poynton Bradbury Wynter Cole Architects.
The glue laminated primary and secondary timber frame structure, prefabricated timber wall panels, roof joists and roof deck were designed and erected onsite by a timber frame specialist. The design information was issued to the design team in conventional DWG format and Poynton Bradbury Wynter Cole Architects modelled the key structural elements within their as-designed BIM model for coordination.
Once erected onsite, the timber frame was 3D laser scanned by local surveyors 3DMSI who delivered the as-built pointcloud of the structure as a fully registered Recap file. It was fundamental that the pointcloud included all the individual scan locations and therefore had not been unified, as well as being positioned to the coordinates of the corresponding BIM model.
Both pointcloud and as-designed BIM model were appended to Navisworks with any non-structural timber elements hidden for clarity. The remaining timber structural elements and the as-built pointcloud were then selected and pulled into Verity using the
‘Add to Verity’ [Selected Node] tool and appeared as itemised elements in table form within the Verity window.
The Analysis
At the click of the ‘Analyze’ button and input of the tolerance required, you can sit back and let Verity do her magic. The processing time will vary depending the quantity and complexity of the data involved. Much like rendering a high resolution image, it is envisaged for complex projects, Verity is the sort of process you would set up and let run over night.
The REEF project analysis of the erected timber frame was undertaken with a tolerance of ±10mm, the tolerance as stipulated in the specialist timber frame drawings and as stated as normally achievable in BS 5606:1990 for timber structural frame-columns and timber components.
Verity took 23 minutes and 6 seconds to complete the analysis which consisted of a total of 68 elements with the pointcloud containing 9 individual scans. On completion Verity opens a Summary Report giving a graphical overview of the results, clearly illustrating the percentage of elements that ‘Pass’, were ‘Out of Tolerance’, ‘Not Found’, or ‘Occluded’.
An additional analysis for the ground floor slabs based on the BS 5606:1990 tolerance of ±25mm for variation from the target plane for non suspended floor slab before laying of screed was also undertaken.
The Results
The workshop slab was found to be within the ±25mm tolerance range. For the timber frame, Verity found 68% [64 elements] to be ‘Out of Tolerance’, 7% [5 elements] to be ‘Not Found’, and 25% [17 elements] which were within tolerance achieving a ‘Pass’.
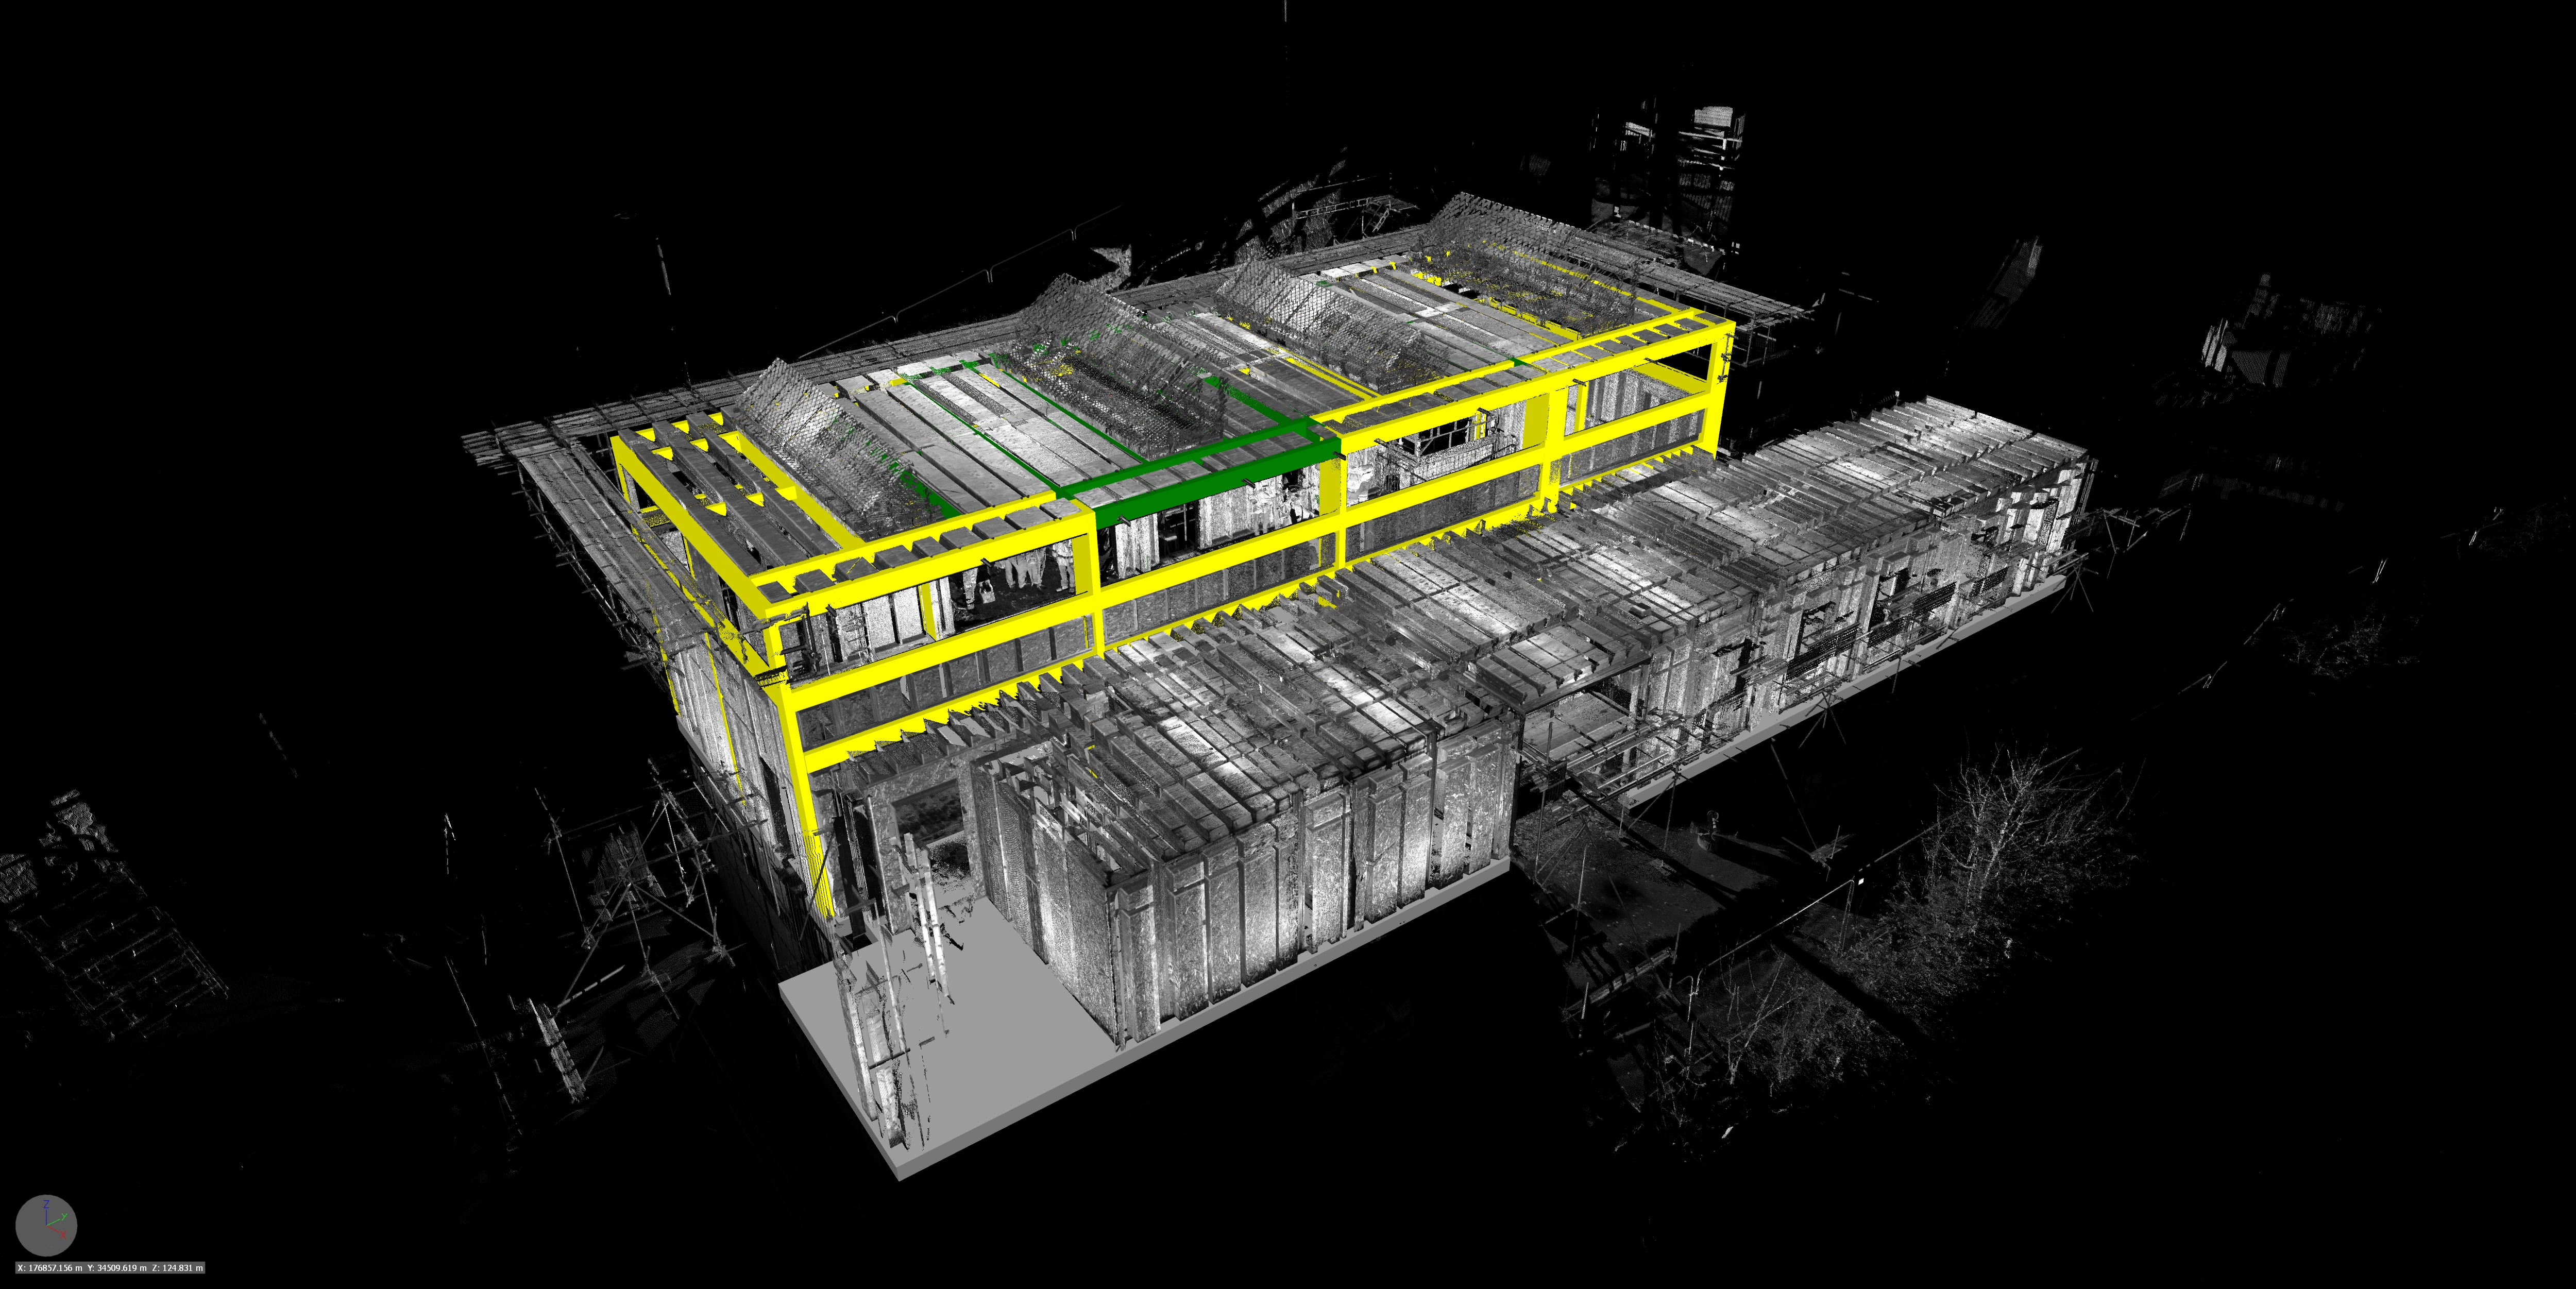
These results can then be pulled back into Navisworks using the ‘Export Verity Properties To Host’ function which colour codes the elements back in the Navisworks model with a green, red, yellow, or black to match the graphical output of a ‘Pass’, ‘Not Found’, ‘Out of Tolerance’ or ‘Occluded’ respectively. This is a great function for those who wish to use the power of Verity’s advanced algorithms but not get sucked into the detail of the analysis as it enables quick identification and review of elements within the Navisworks model space.
The 5 elements that verity identified as missing were highlighted in red. These timber members had been coordinated to support the track and spring mechanism for the sectional industrial door. At the time the 3D laser scan was undertaken, these elements were yet to be installed and Verity successfully identified their absence clearly illustrating this back within the Navisworks model space.
The Detail
Furthermore, Verity has the ability to visually interrogate each analysed element, log the ‘Installation Status’ and input additional information like ‘Action Required’, ‘Reviewer’, or ‘Review Status’ within Verity itself. By highlighting the element from the table Verity will zoom in on the instance displaying the as-designed geometry in purple, the pointcloud as series of white points [which can be toggled to the original host colour], and the generated as-built geometry in cyan. All of these can be toggled on and off depending on what information is required for the review. The 3D geometry can be viewed in orthographic or perspective views, as single window or split window arrangement and be zoomed, panned and orbited like any conventional 3D model.
Through interrogation at this detail you begin to see the subtle and more explicit variations between the as-designed geometry and generated as-built geometry not only in the form of horizontal and vertical translations but also horizontal, vertical and sectional twist rotations.
We jumped to some of the larger anomalous discrepancies identified by Verity where it could be seen that Verity had actually incorrectly generated the as-built geometries which in turn was incorrectly producing some large ‘Out Of Tolerance’ results. This was the case for 12 perimeter beam elements all located within the same junction detail.
It was clear to tell that these anomalies were derived from the non-inclusion of the timber wall plates in the as-designed model during the analysis as Verity had taken the underside of the wall plate from the as-built pointcloud to be the underside of the beam, and subsequently generated the as-built geometry of the beam the thickness of the wall plate lower than it should have been. This was consistent for all 12 perimeter beam elements located at the that elevation with that detail.
Visualised Heatmaps
A heatmap and associated heatmap scale bar can be turned on to visualise either the deviation of the generated as-built geometry from the as-designed, or the deviation of the generated as-built geometry from the scanned pointcloud. The heatmap tolerance range can be increased, beyond that undertaken by Verity in the subsequent analysis, by using a tolerance factor which could be very helpful in some situations, saving the need to re-run additional analyses where a different tolerance range maybe required.
True As-Built
Verity has the ability to move the selected elements to their as-built locations, again via a click of a button. By selecting a single element or multiple elements from the table in Verity and clicking ‘Move Host Item To As-Built’, Verity will push its as-built geometry back into Navisworks replacing the as-designed element locations with the as-built locations. This is a powerful function giving the reviewer the ability to quickly produce an accurate as-built model of the constructed work onsite to be utilised for the duration of the project and continued building’s life cycle. Pointcloud data of the as-built host geometry, as-built heatmap or as-designed heatmap can also be exported from Verity to native software packages used by the design team to update their respective design models for an accurate as-built model.
Reporting
The results from Verity’s analysis can be exported in CSV format or HTML. The CSV format will export the selected items from the itemised table in Verity enabling them to viewed or shared in Excel. The HTML format can be exported as an overall summary report of the analysis, a table of the selected items, or a table of the selected items with hyperlinked detailed report illustrating the element’s deviations as numerical data and graphical heatmap imagery. These functions combined with the ability export the as-built pointcloud data and push Verity’s as-built geometry back into Navisworks make sharing Verity’s results simple and straightforward.
Moving Towards Zero Tolerance?
Variability in construction may well be inevitable, however understanding and managing that variability is crucial to a project’s success in order to avoid clashes, rework and delays. A select series of spot checks with a tape measure or total station theodolite is no longer a compatible workflow with the complexity and millimeter precision of components and elements placed within BIM models now issued by Architects, Engineers and other design team members. Thus, utilisation of the 3D laser scan, capturing onsite progress at a forensic level of detail, and its comprehensive analysis with an automated verification software like ‘Verity’ is an extremely powerful workflow. A workflow that could be used not only by contractors as part of their internal quality assurance and quality control procedures, but also by more savvy architects and clients alike.
‘Verity’ is not intended to replace the role of Quality Assurance or Quality Control reviewer, but instead its ability to analyse large amounts of detailed geometry in an automated manner facilitates the review of many more results to a much higher degree of detail. This combined with its ability to update model geometry to represent the as-built provides a workflow with not only greatly improved project accuracy during the construction stages, but also enables this newly identified accuracy to be passed onto end-users and facility managers throughout the building’s future life cycle.
www.pbwc.co.uk
www.3dmsi.co.uk
www.kier.co.uk
www.jacobdown.co.uk